
I know the big question on everyone’s mind is: How is the housing market actually doing? And more importantly, what’s happening to my home’s value? Let’s dig into the numbers, trends, and some context that’s shaping today’s market.
The Numbers: Modest Increases, But Not a Seller’s Market
Year-to-date, comparing 2025 to 2024 through June, we’ve seen the average sales price increase by 1.2% — from $607,800 to $614,880. The median price also edged up 1.5%, now sitting at $550,000. Over the past 12 months, that brings the average home price up 1.3% with an average at $611,000. Seems pretty stable on paper, right?
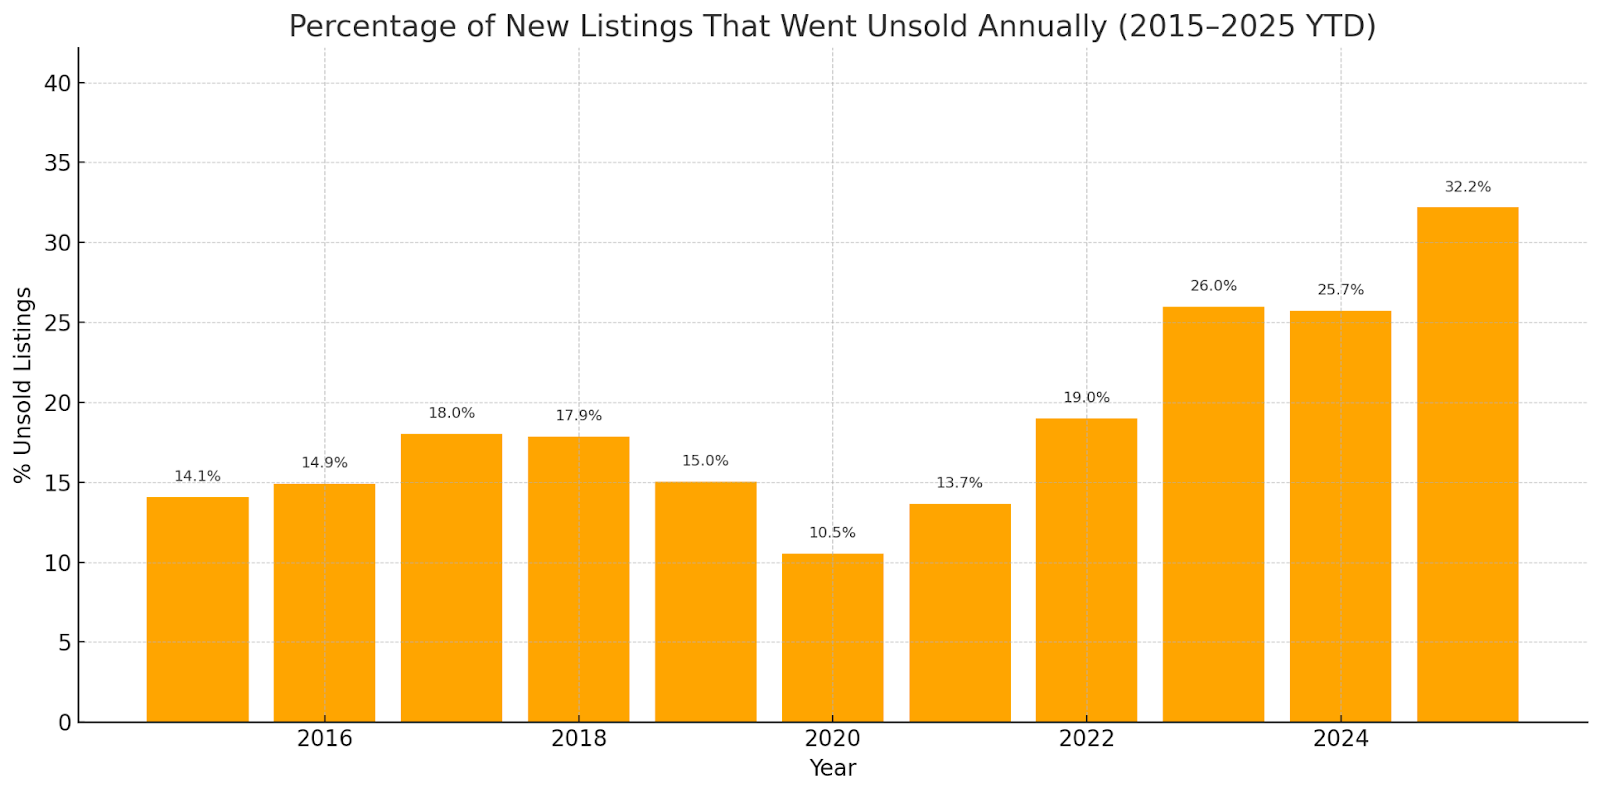
But here’s the reality: This is not the aggressive seller’s market many homeowners remember from a couple of years ago. We’re seeing increased patience required from sellers — homes are taking longer to sell, and if sellers aren’t pricing realistically from day one, those homes are just sitting on the market (sometimes for months). In fact, around 32% of homes in the Portland metro area are not selling. That’s a far cry from the days when every listing seemed to attract multiple offers the first weekend.
Affordability: The Real Driver
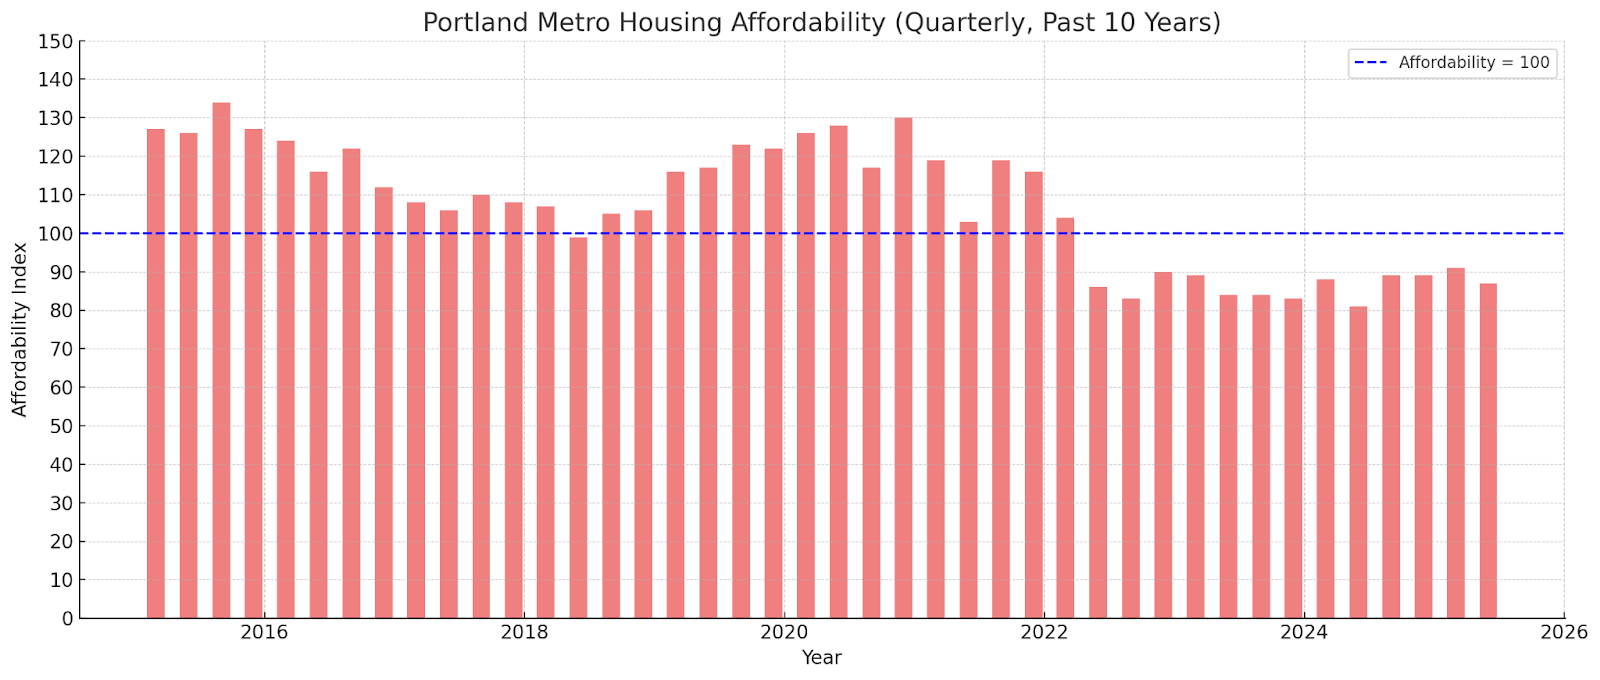
Let’s zoom out for a minute. For most of 2015 to mid-2022, the median Portland family could afford 120–135% of the average mortgage payment for a median-priced home, thanks to low home prices relative to historically low interest rates.
Today, that same median household can only afford around 80–87% of that monthly payment. Prices have gone up, yes, but the real story is how rising mortgage interest rates have fundamentally changed the equation for buyers. The pool of people who can actually *afford* to buy in this market is far thinner than it was five or ten years ago.
And here’s the kicker: People can’t (and don’t) buy what they can’t afford, no matter how much they want to.
Inventory and Buyer Dynamics
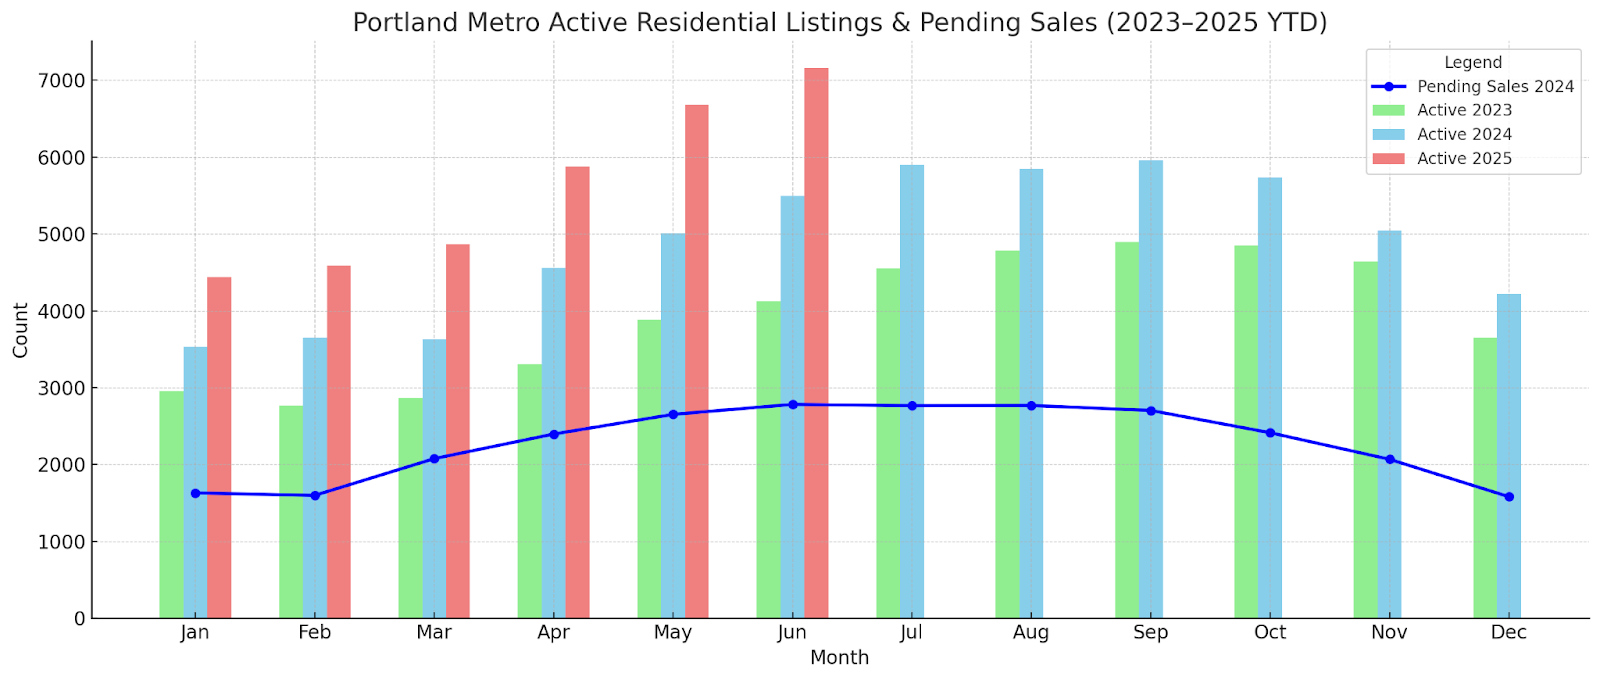
We keep hearing that there’s a housing shortage, but in the short term, I don't believe that is the case. The number of pending sales (homes actually going under contract) is basically flat over 24 months and that trend is deeply established and the gap between listings and sales is bigger than usual. That means more homes are and will sit unsold.
What does that mean for you? If you’re selling, you’re in the most challenging market we’ve seen in a decade. If you’re buying, there’s opportunity — especially if you’re looking at homes that have been on the market for a while. Don’t be afraid to negotiate.
What’s Next?
Affordability isn’t magically going to improve unless we see rates come down below 6%, maybe even below 5%. Otherwise, prices would need to drop to bring buyers back in. But here’s the thing: Sellers are reluctant to take what they see as a loss, especially when most are sitting on low fixed mortgages. So, instead of dropping prices en masse, many simply pull their homes off the market and wait.
My advice? Whether you’re buying or selling, understand the market you’re in — not the one you wish you were in. Consider the trade you are making in your living situation and weigh the pros and cons. Strategy, patience, and a good grasp of the data are more important than ever.
If you have questions about your specific situation or want to dive into the numbers for your neighborhood, reach out. We’re here to walk you through, with the real data, every step of the way.
David Caldwell
Principal Real Estate Broker